◷ Reading Time: 6 minutes
Introduction
Job information including job executing times, running services, requests, responses, and exceptions of the job can be viewed under Logs.
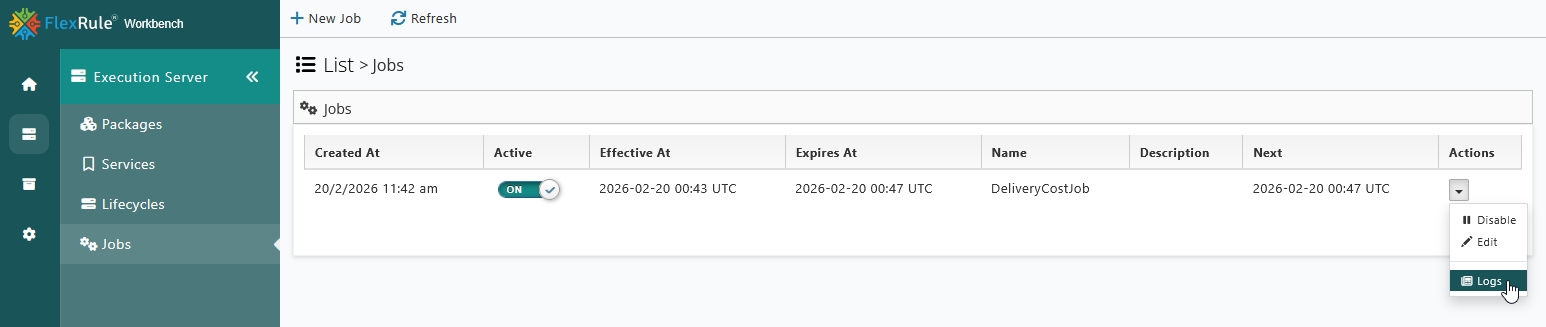
Go to Execution Server --> Jobs and under Actions menu of a Job, select Logs. You will navigate to the logs of the selected job.
This will open the Log list view where you will see the main list of instances for the Job. This includes the Instance ID, Executing Worker that processed the request. The Status of the instance execution, Running and Finished At date stamps and an Actions menu.
In the top left menu there is a option to Refresh the log view and return to the Jobs list.
The log view is not dynamically updating and although some menu actions do trigger refresh, such as applying filters. Generally the Progress display of the job requires a refresh to update.

Job Information
The Job Information option will expand further details of the job. This includes the job Name, Description, Job ID, the selected Package and Service and and Active status of the job.
Further details are Effective and Expiry timestamps, The CRON recurrence and the next scheduled execution.
If running a batch job you will see either a Job completed indicator with the number of completed, the duration of the job and average request times.
Or you may see an incomplete progress bar with the percentage executed, the number completed and the total job instances scheduled.
If a job is incomplete it is possible there are Abandoned messages. This will happen when a message is running but the Worker is unresponsive and the message abandoned. The timeout for this can be set in the Job settings.
Abandoned messages can be retried later to complete the job.
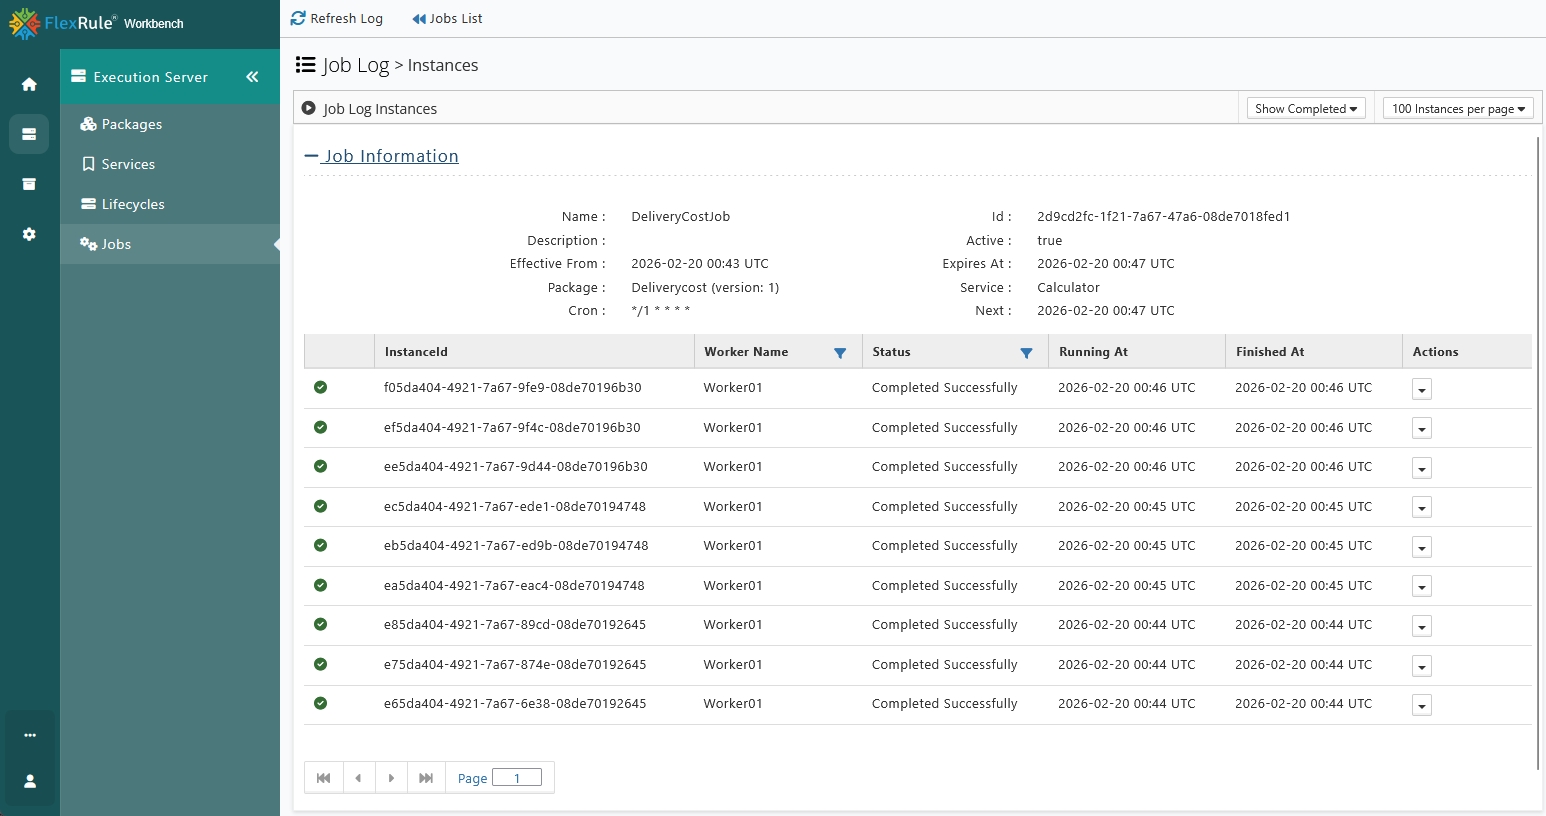
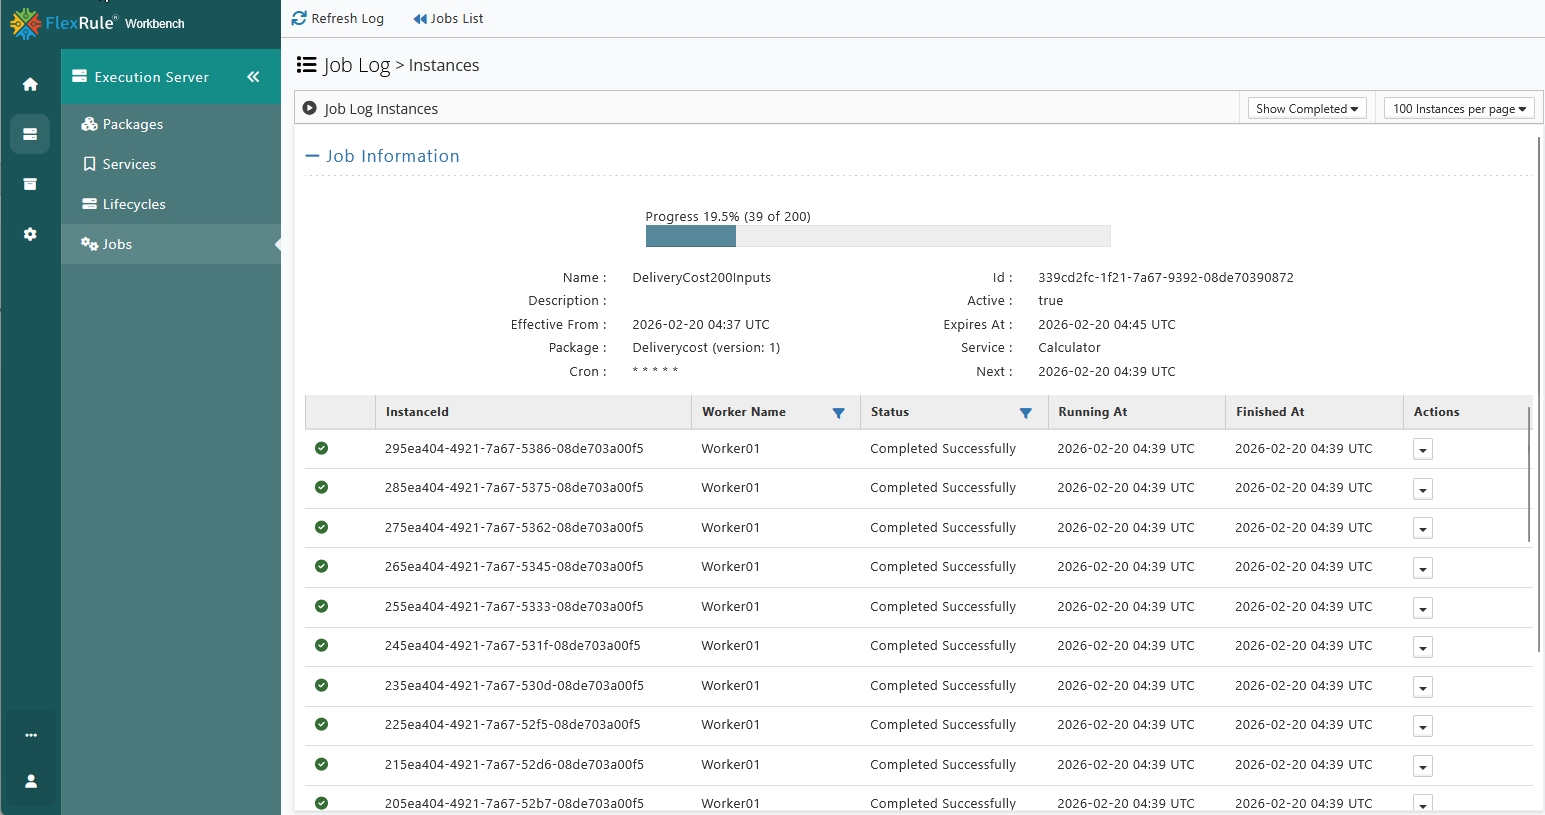
Logs view showing the job information and notification the job was19.5% complete. The Job Instance table shows the filtered view of job status.
Job instance results view
You can view the details of all individual Job instances to see what request was sent, the response and exceptions.
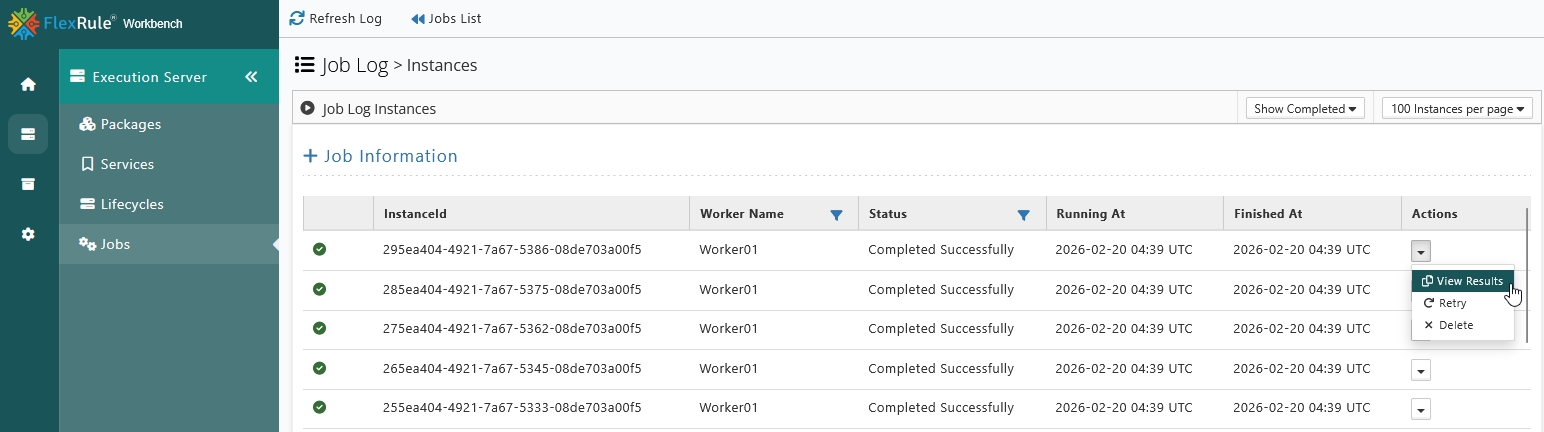
From the Actions menu, select the View Results option.
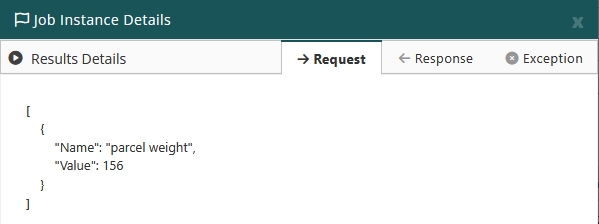
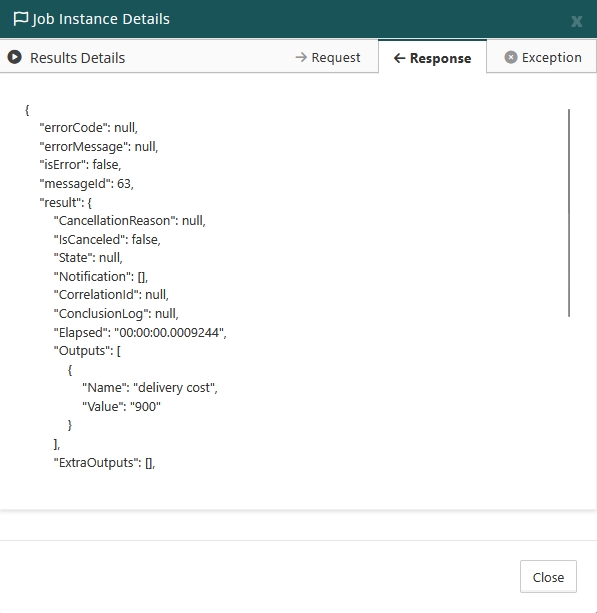
The Job Instance details modal will display including three tabs, Request, showing the JSON request object for the job, Response, showing the JSON response object and Exception, giving details of any exception for a Job Instance.
Job Instance status details
Queued – When a job instance is placed in the queue for processing.
Completed Successfully – When a job instance is completed without error and result is successful.
Completed with errors – When a job instance is completed but has error in the result. This could be due to errors in the service or request.
Check the View Results option under the Action menu of the job instance for further details.
Retry with Errors – A parent job instance that has errored in a retry attempt.
Check the View Results option under the Action menu of the job instance for further details.
Retry Successfully – A parent job instance that was completed successfully in a retry attempt.
Abandoned – When a running job instance is terminated without completion due to an unresponsive Worker.
Filtering Job Logs
Within the Workbench Job Logs there are a number of filter options to help display the information you need.
In the top right of the log view there are two filter, the first is Show Completed and allows filtering to display Completed, Queued and Abandoned Job Instances. By default this is set to Show Completed.

The second filter is Instances per page with three options, 10, 50 and 100. This filter controls how many instances to display in the visible Job Instance table.
Pagination
At the bottom left of the Job instances table there is a pagination widget. This gives the ability to progress forward and back a page at a time. You can also jump to the last page or back to the first while also key in a specific page number and hit return to jump directly to that page.

Job Logs table filters
There are further options to filter within the Job Instances table itself. The Worker and Status columns both display a filter icon in the right side of the header cell.
The Worker filter allows the Log table to display instances for specific Worker(s). The filter option is multi select.
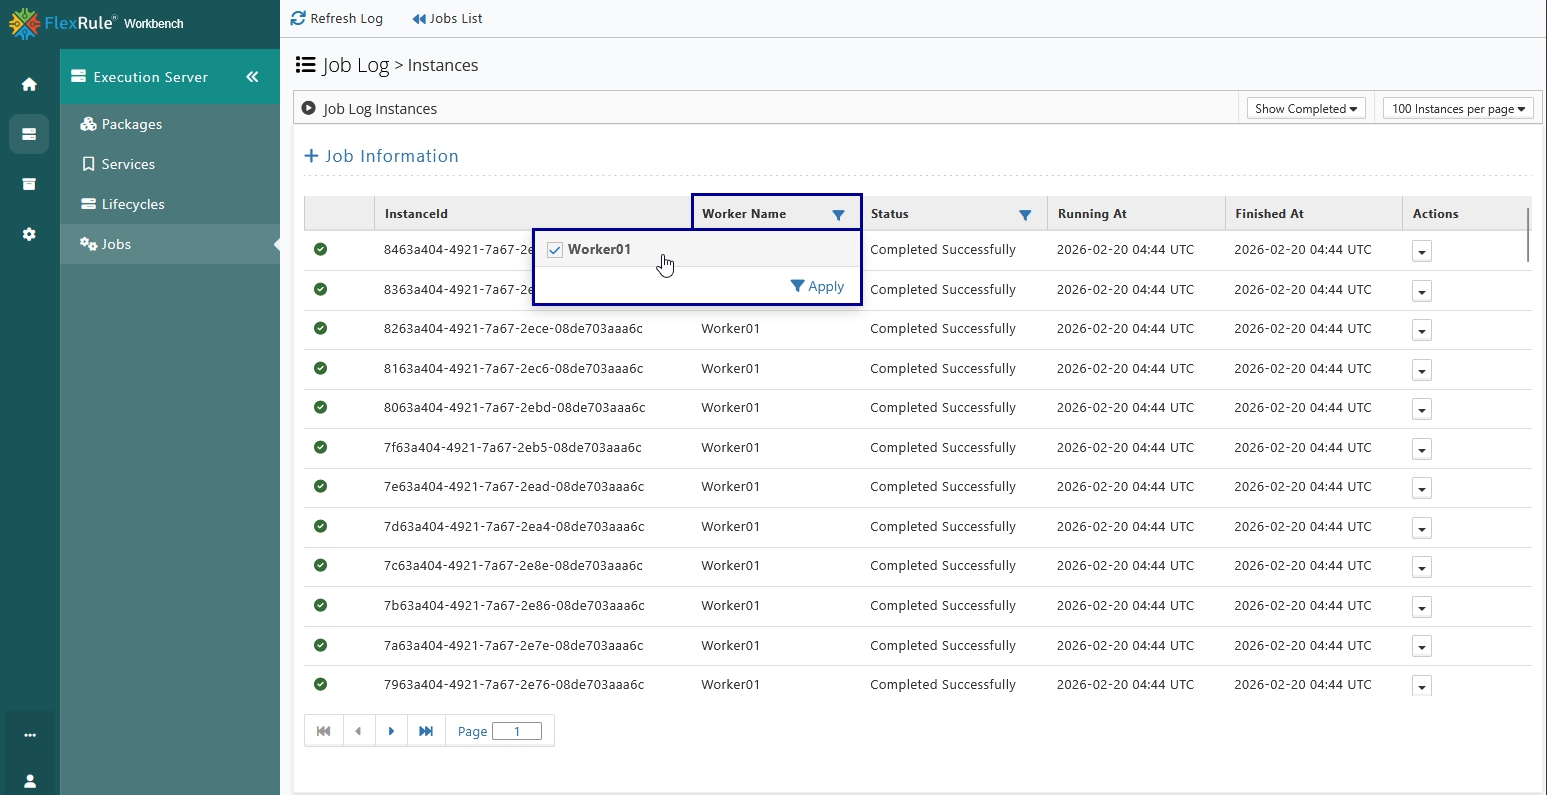
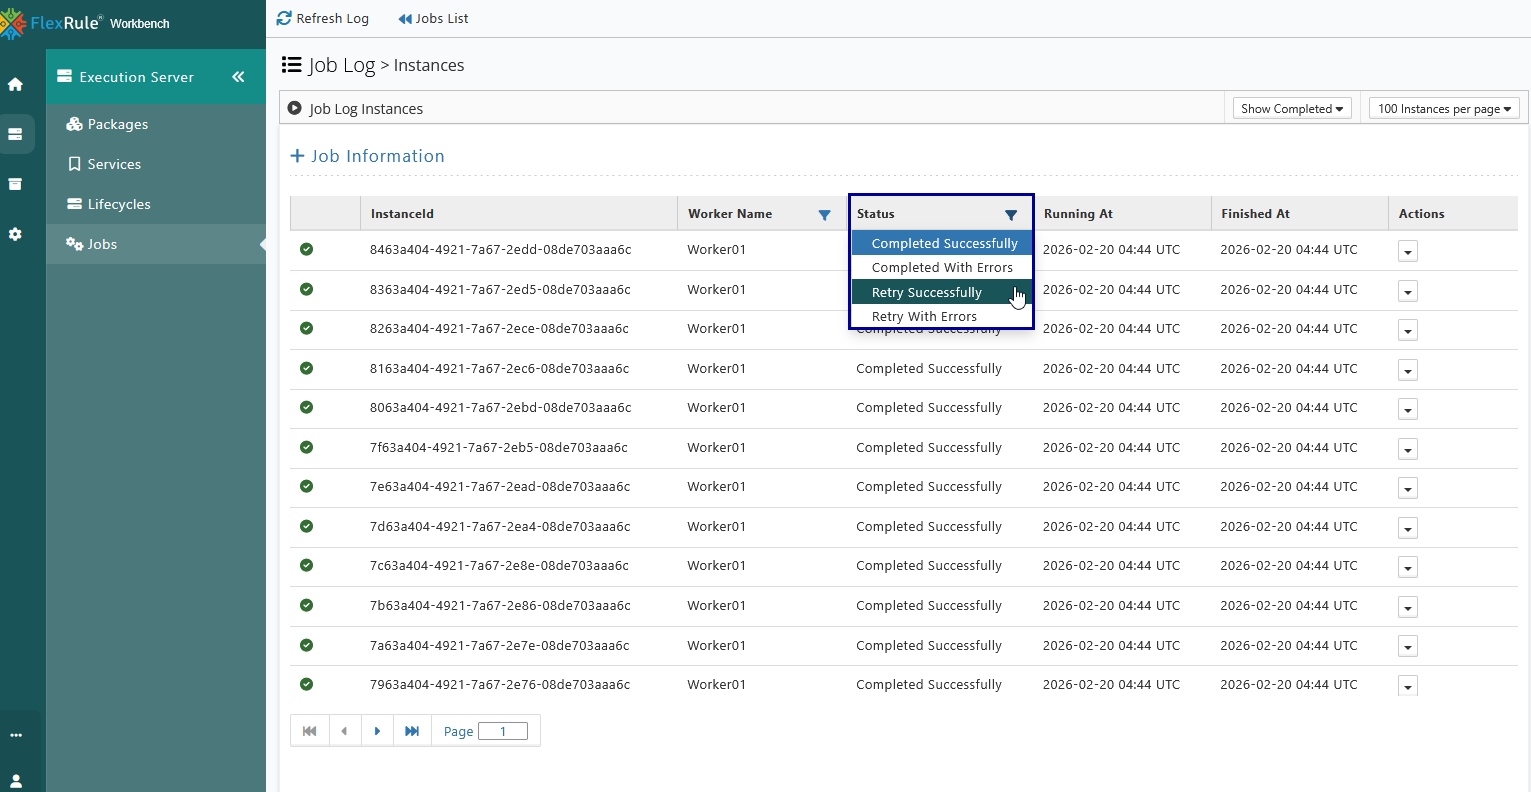
The Status column can be filtered to display all Completed Successfully, Completed with Errors, Retry Successfully and Retry with Errors messages.
When filters are applied an information alert will display to confirm you are viewing a filtered version of the logs and an option to clear the filters back to the default state.