
◷ Reading Time: 8 minutes
Introduction
Once a workflow is modeled in FlexRule Designer or FlexRule Decision Studio, you can directly deploy it as a service to the FlexRule Open and test run via Workbench. The following steps will show how to successfully deploy a workflow as a service and test it in Workbench.
Build and Upload a Workflow
- First, you need to model your workflow either using FlexRule Designer or FlexRule Decision Studio, create a package/module, and deploy it as a service to FlexRule Open.
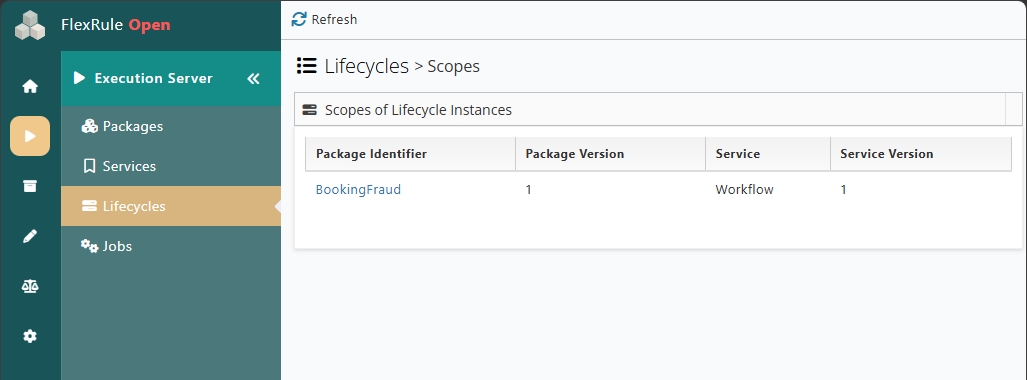
- The deployed workflows can be seen under
Execution Server > Lifecycle.
Provide Permissions to the Role to Run Workflows
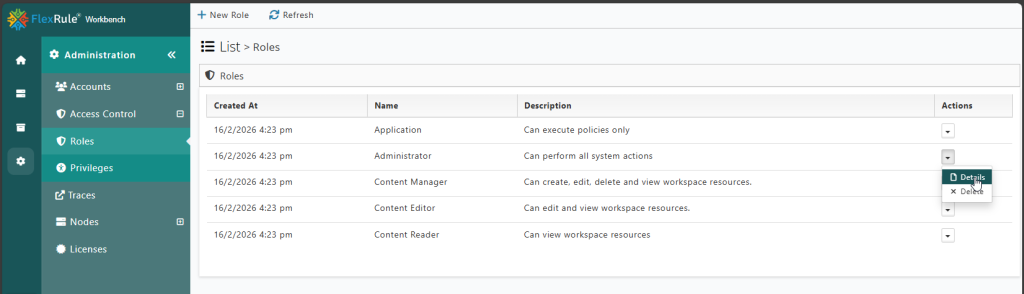
- Go to
Administration > Access Control > Roles. - Click the Details for the role of the user you want to grant access to run the workflow. For example, here is the Administrator role.
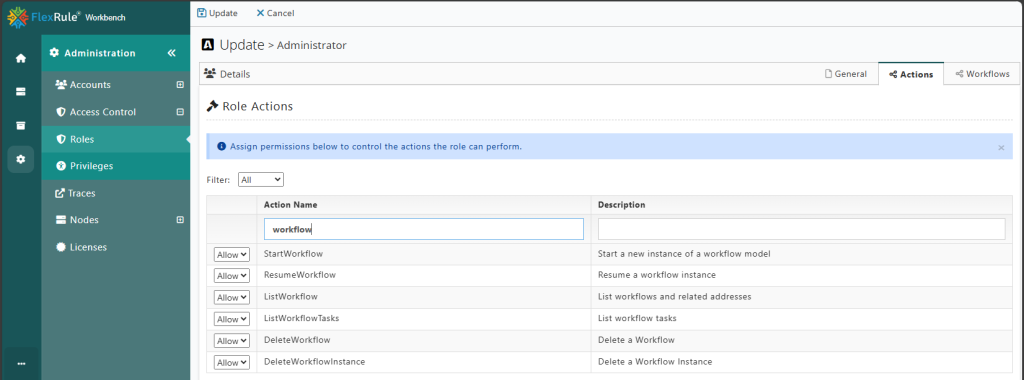
- Search for Work under Action Name and allow the actions related to Workflow.
Workflow with Timeout Node
If your Workflow has a timeout node, this step is compulsory.
For every Workflow deployed in the FlexRule Open, 2 jobs are automatically created.
- Workflow.Timeout.Pulse – Global pulse that looks for timed-out workflows.
- Workflow.Timeout.Commit – Workflow timeout node poster that advances the timeout node by sending the right signal for timeout.
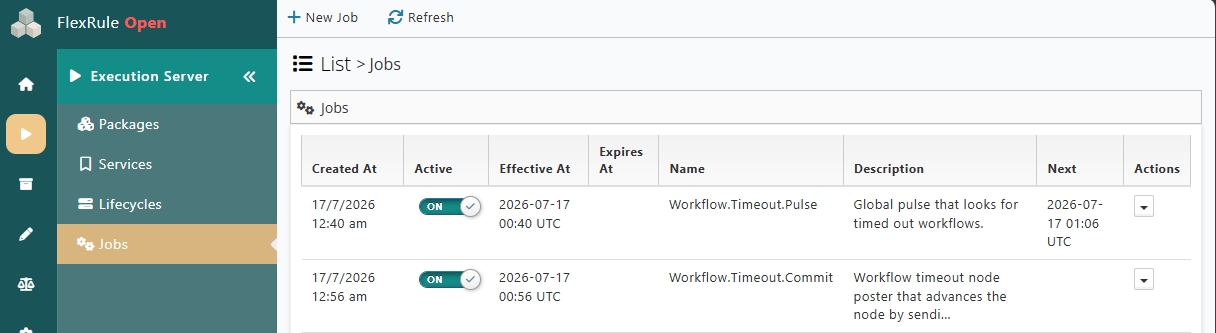
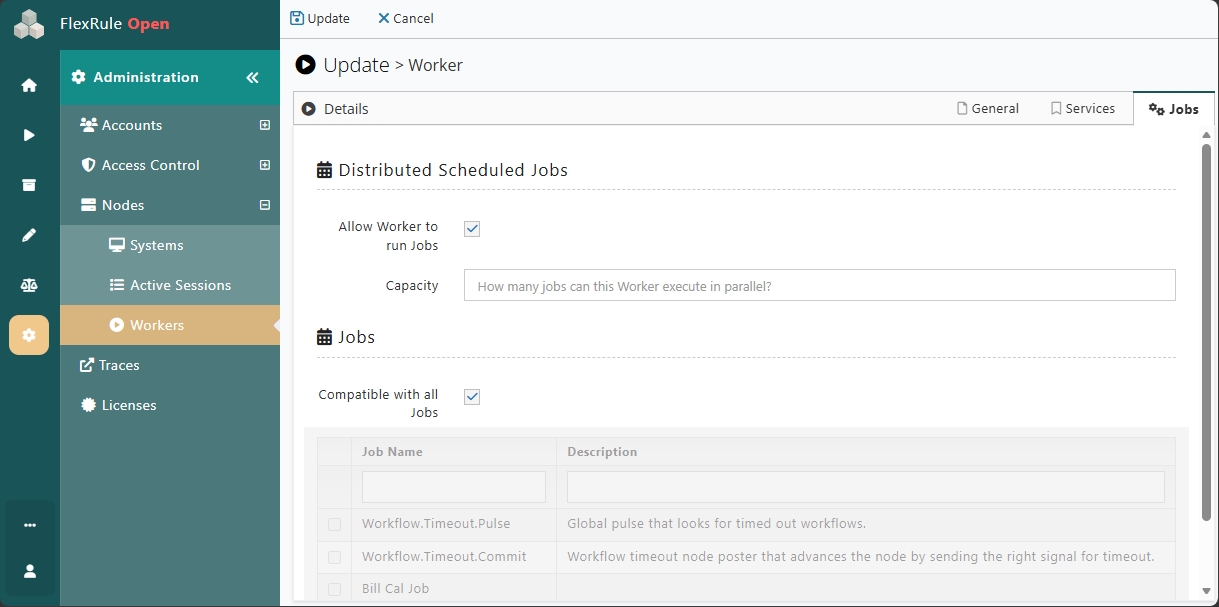
In order to run these jobs automatically, you should allow your Worker to run these jobs. Make sure you navigate to the Workers -> Jobs and then tick “Allow Worker to run Jobs”. Then in “Jobs” section down below, you can either select these 2 specific jobs or tick “Compatible with all Jobs”.
Test Run the Workflow in Workbench
Navigate to Packages and then to your deployed service.
Once you make the initial request for a workflow, it goes to a waiting stage. After that, if there is any human interaction or receive task option, you can resume whenever it is necessary.
The Initial Request
- Go to Execution Server > Services
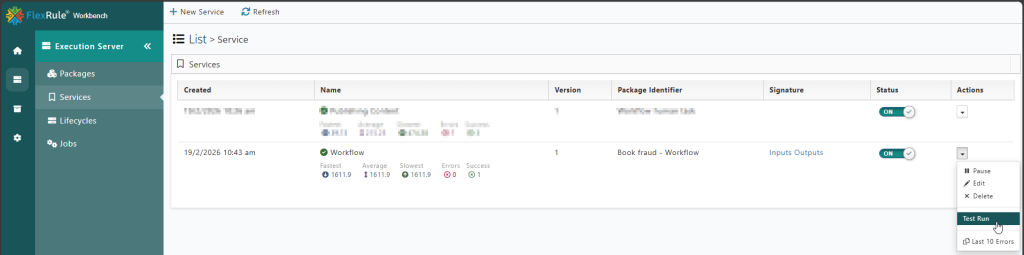
- Click on Test Run of the Workflow you want to run
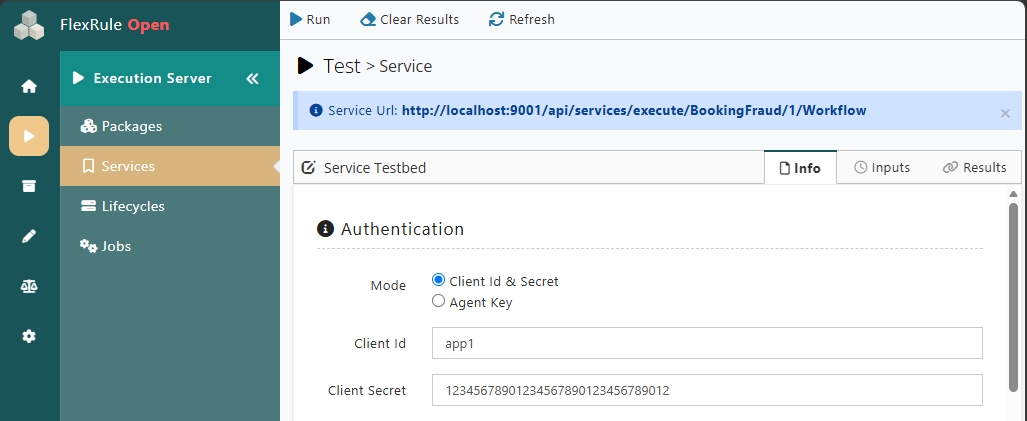
- Enter the relevant authentication granted for this package. You can use either a User account, a Client account, or an Agent key to execute the service.
- Enter the sample input under the Inputs tab.
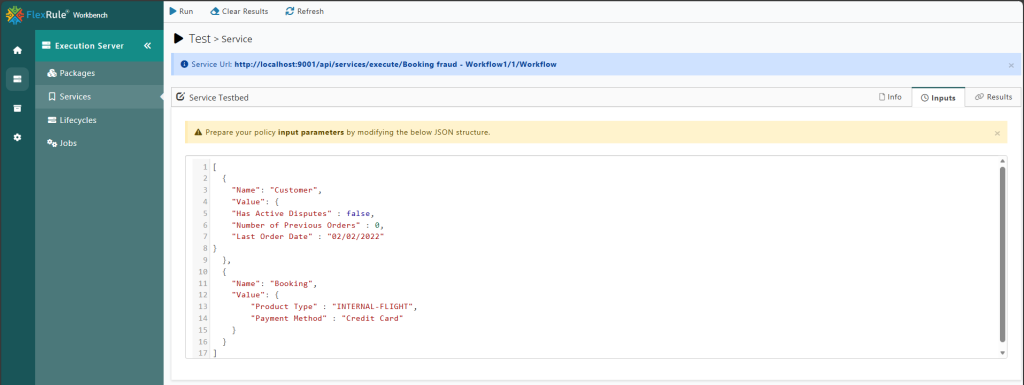
Or if there is no input, you can keep it empty with [ ].
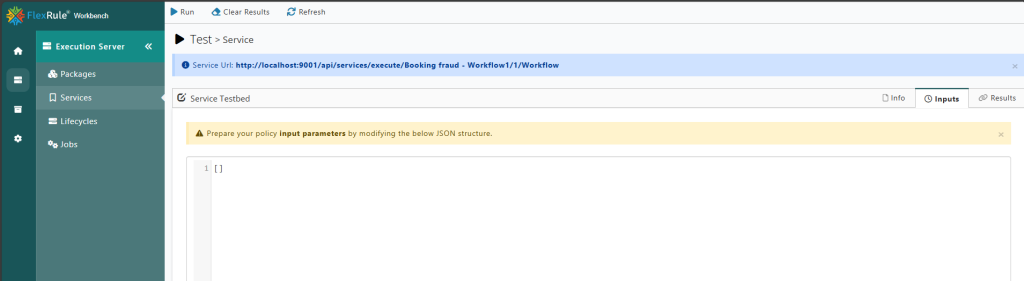
- Click on Run.
- If both Authentication and Execution are successful, you will see the output as a success under the ‘Results’ tab.
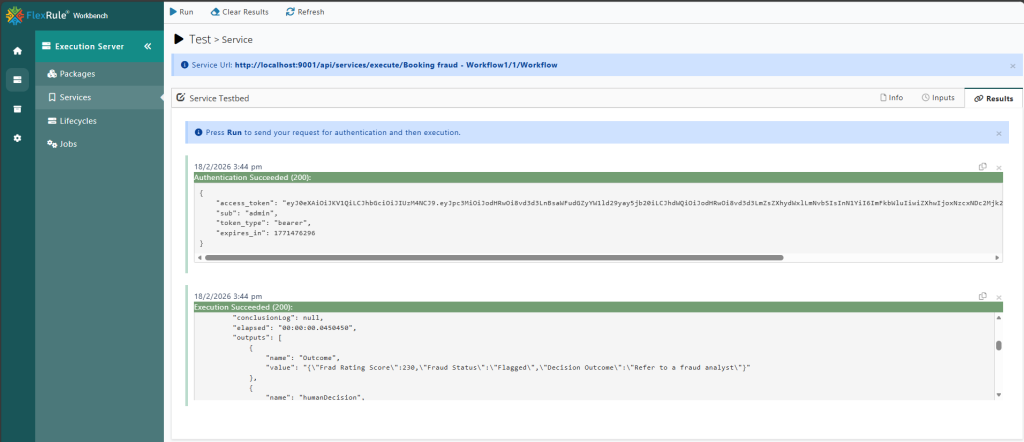
Resume the Workflow
- If you see a receivers tag in the Execution section after the test run, that indicates that the workflow is waiting for human interaction.
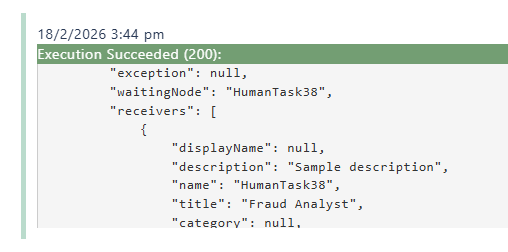
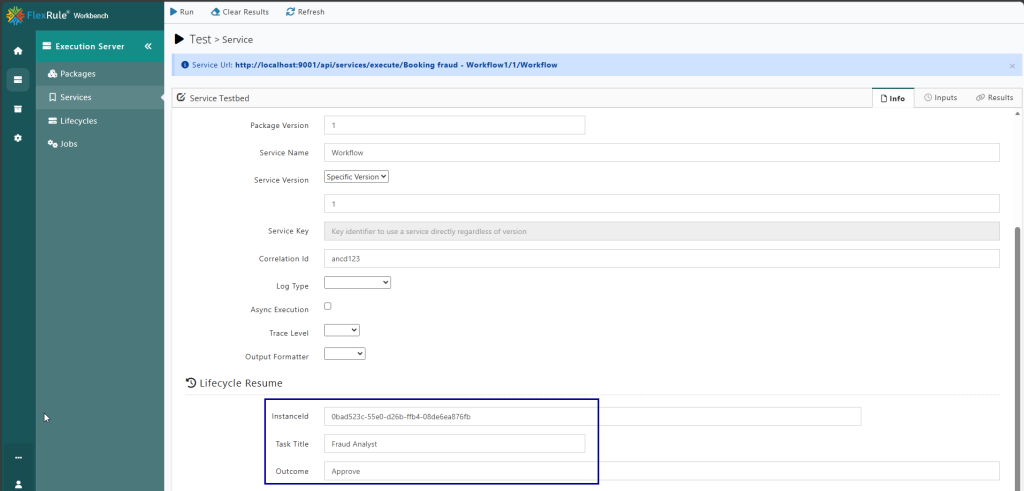
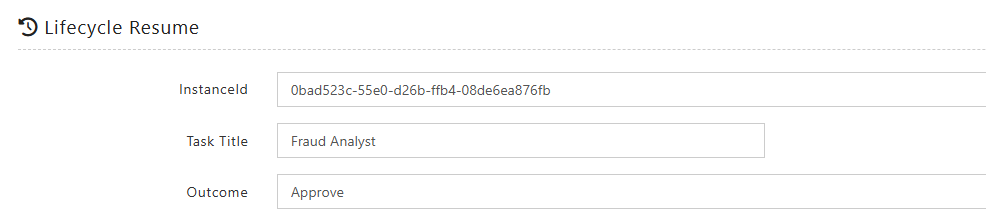
- If so, copy the workflowInstanceId and title.
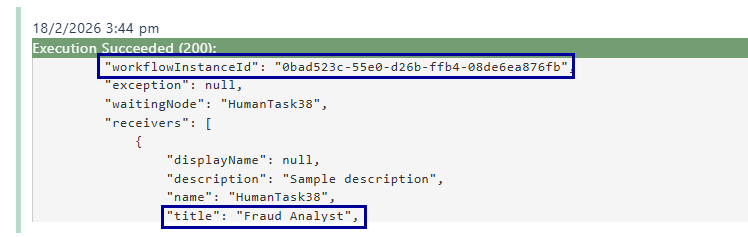
- Paste them in the Lifcycle Resume under the info tab.
- Enter the human interaction option in Outcome.
In this example, it is an approval (Approve or Reject).
- Delete the input under the Inputs tab if the next step doesn’t need it.

- Click on Run.
- You will see the output accordingly.

If you go to Lifecycles and click on the workflow, you will see its status.
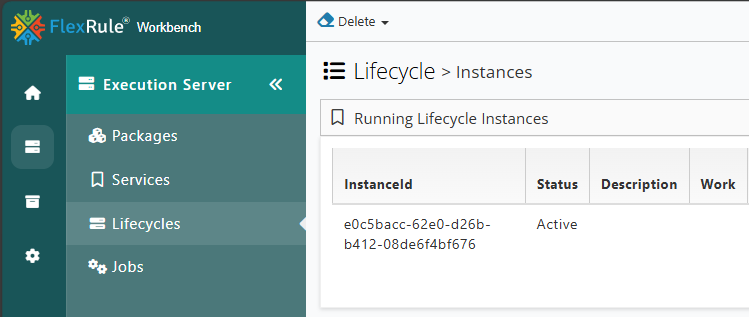
In the actions column you can view the workflow’s history, or delete it.

Test Run the Workflow via Postman
Please navigate to the article here, which explains the details step by step.
Troubleshooting
The following methods can be used to troubleshoot.
Turn on Debug Trace
If there is any error, you can see it in the test results.
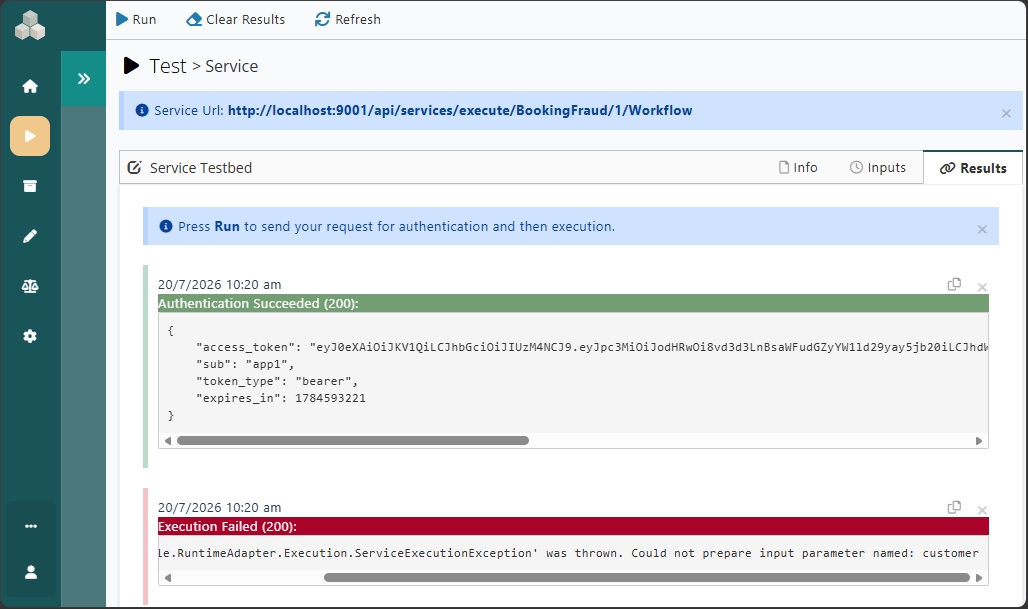
You can turn on the debug trace to see the full trace. This option is under the Info tab.
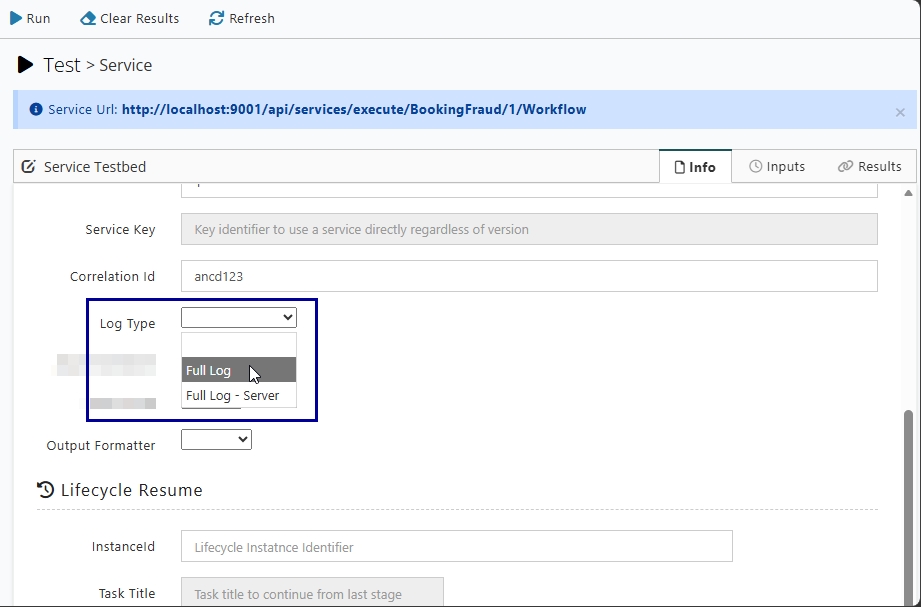
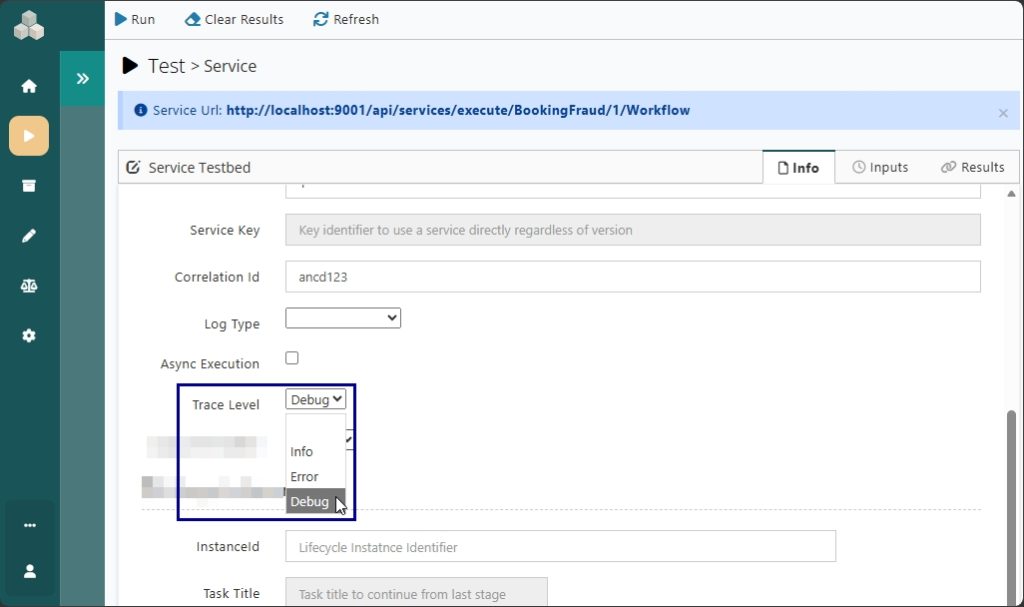
Turn on the above debug trace and Run the service again to see the full trace.
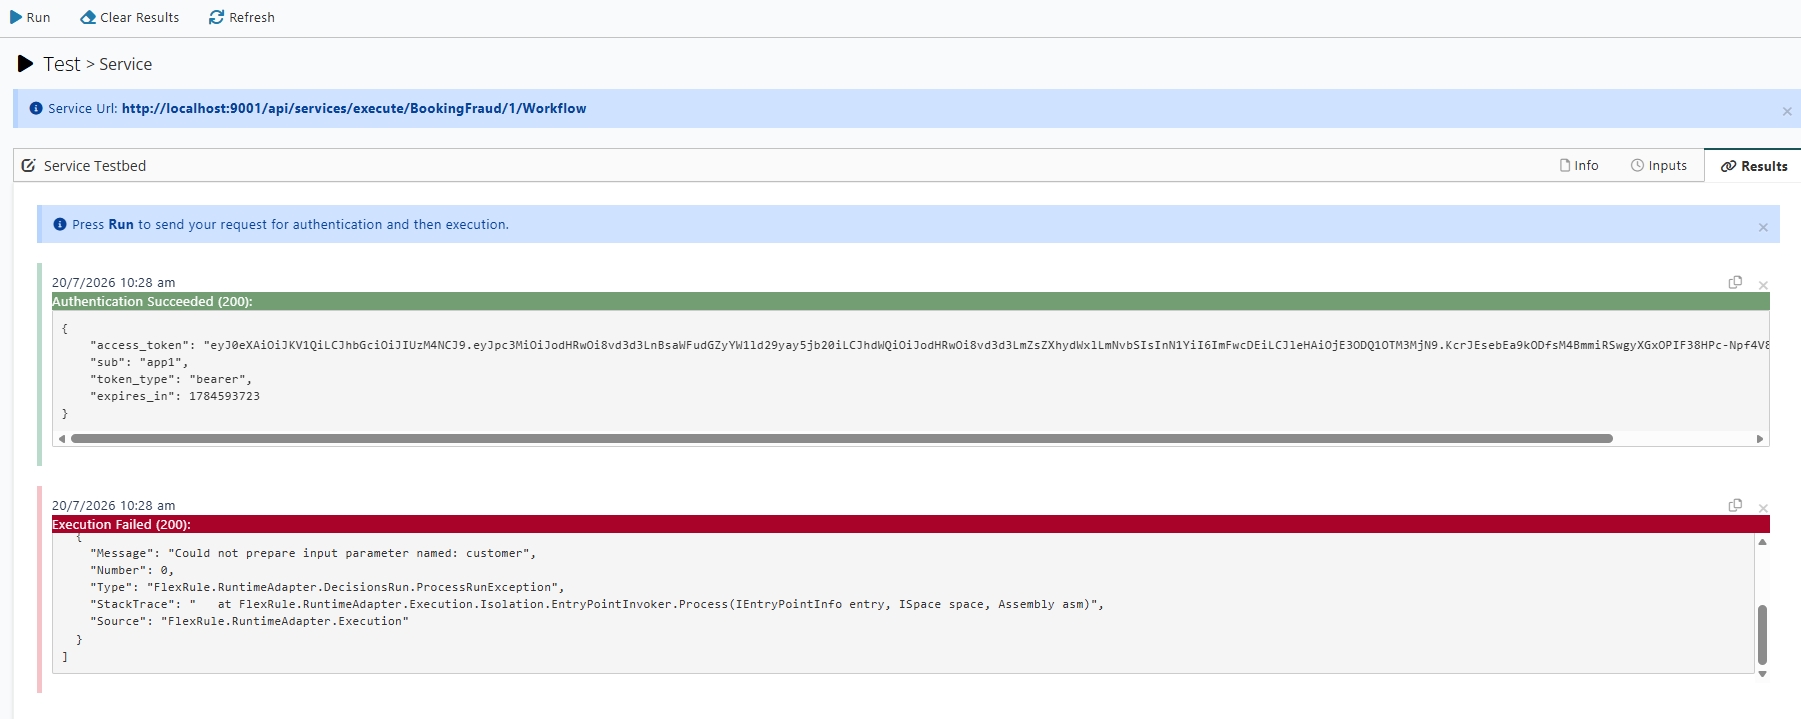
Download Service Log
Once you run the workflow, if there is any error, you can see it on Execution Server > Services page under each service.
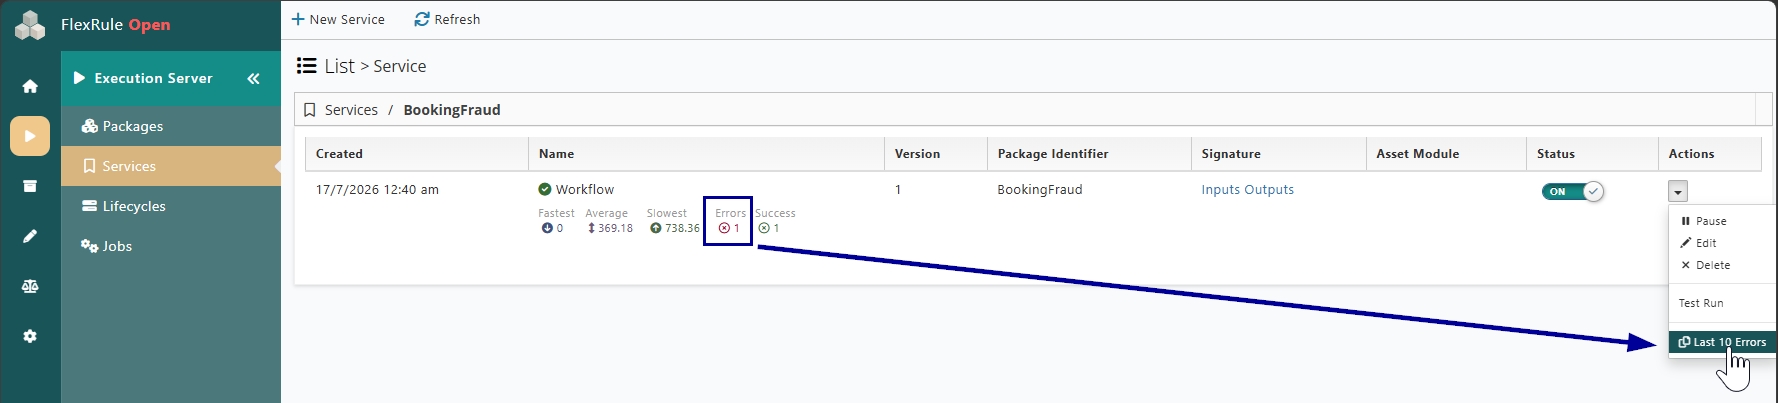
You can view errors by clicking on the Actions drop-down and choosing the Last 10 Errors.